As no individual, business, or government is immune from being the victim of the next large-scale cyberattack, organizations need capabilities to help identify, contain, and investigate what seems like an inevitable incident. By performing forensic analysis, you can gain and leverage valuable insights to take the right steps to contain and mitigate the attack while becoming more resilient in preventing attacks in the future. But as we transition into a cloud native environment, the forensics process gets quite a new dimension.
Why forensics is different in cloud native
With developers deploying code changes at high speed, the challenges of doing forensics are amplified by the dynamic nature of workloads. In contrast to a physical server or VM which may remain untouched for months, containers are lightweight and ephemeral compute tasks that can be spun up and down by an orchestrator as needed and stopped at any moment. They are very short-lived – the average lifecycle of a container is measured in a few hours. Serverless functions are even more ephemeral, with a typical AWS Lambda function running for only up to 15 minutes per execution.
These extremely short lifespans have broad implications for security, visibility, and forensics. Since containers are ephemeral, any data written to the container filesystem will usually be deleted when the container shuts down (unless it can be transferred to another location). Orchestration tools like Kubernetes take over the job of scheduling what workload should run on which machine. As a result, teams no longer know with certainty which host will run the application until it’s deployed.
Put simply, when performing forensics in cloud native you have to deal with:
- Highly dynamic environment
- Ephemeral workloads
- Deployments spanning multiple clouds
- Hundreds or thousands of running containers
The importance of forensics in today’s enterprise organizations is magnified by the growing sophistication of attacks specifically targeting the cloud native stack which often leave no evidence and might go unnoticed for a significant period of time. For example, it took Tesla six months to identify the breach that happened through their Kubernetes console. If attackers manage to exploit a cloud native application, by the time an attack is identified, the container and the pod will probably no longer exist, making incident response and forensics more challenging than ever before.
Applying forensics to cloud native
While containers are the cornerstone of modern software development, traditional forensic tools do not have visibility into container workloads.
In the event an attacker has infiltrated your environment, you need to start collecting the evidence to understand the attack kill chain and timeline of the attack. It’s important to remember that the bad actors will likely not attack your containers for the application itself. Commonly, they’re looking to exploit your infrastructure to steal compute power (cryptocurrency mining) or break out of the container to compromise the host (container escape) and perform lateral movement through the network.
So, if traditional forensic tools aren’t helpful in cloud native, what should you do? Here are some best practices you can follow to gather incident data from your applications:
Leverage cloud providers’ capabilities
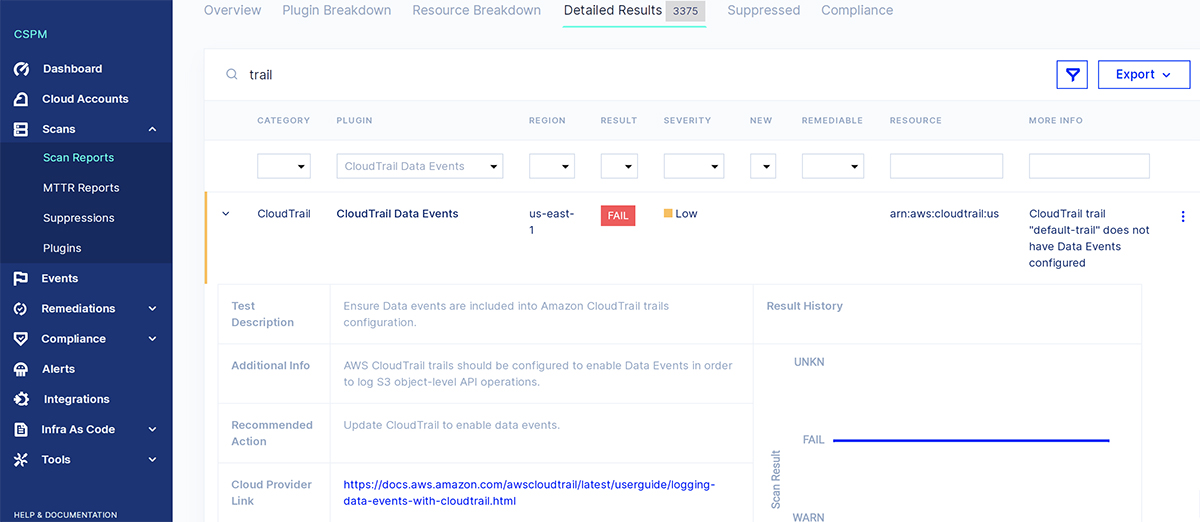
To start, you can take advantage of your cloud providers’ native logging capabilities – these logs provide a rich data set that you can use in forensic analysis. One way to ensure they are enabled in your environment is through a Cloud Security Posture Management (CSPM) solution like Aqua CSPM that scans your cloud infrastructure for configuration issues and compliance risks.

CSPM can ensure CloudTrail is enabled for all regions within an account
However, cloud provider logs typically capture only control plane and OS logs and don’t include the application logs (what is taking place within the container itself). To be able to reconstruct a full picture of the attack, having constant visibility of everything that’s going on within your containers is paramount.
Establish a centralized logging mechanism
The ephemeral nature of workloads means that logs and monitor records are not persistent which makes identifying the true cause of a problem more difficult. To ensure you have application data available, it is necessary to collect all the logs in a single location where they can be persistently stored.
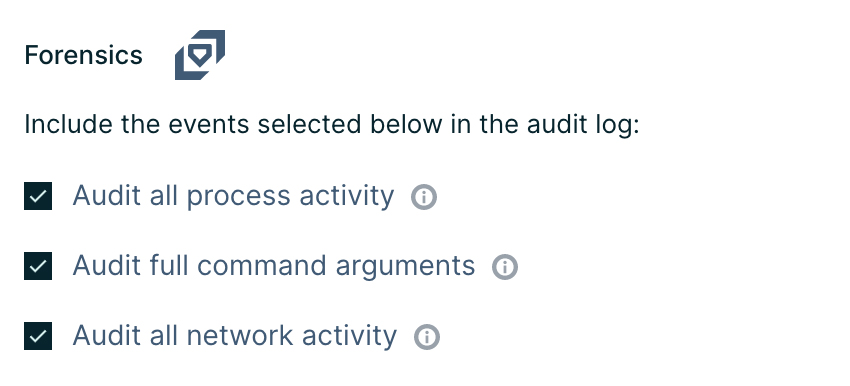
To address this, the Aqua platform, for example, provides real-time data collection and continuous monitoring of every action performed by both orchestration tools and users on the container engine as well as all activity within the containers and serverless functions. Both successful container activity, as well as blocked actions, are logged to provide deep visibility into the kill chain of an attack.

The Aqua runtime forensics control
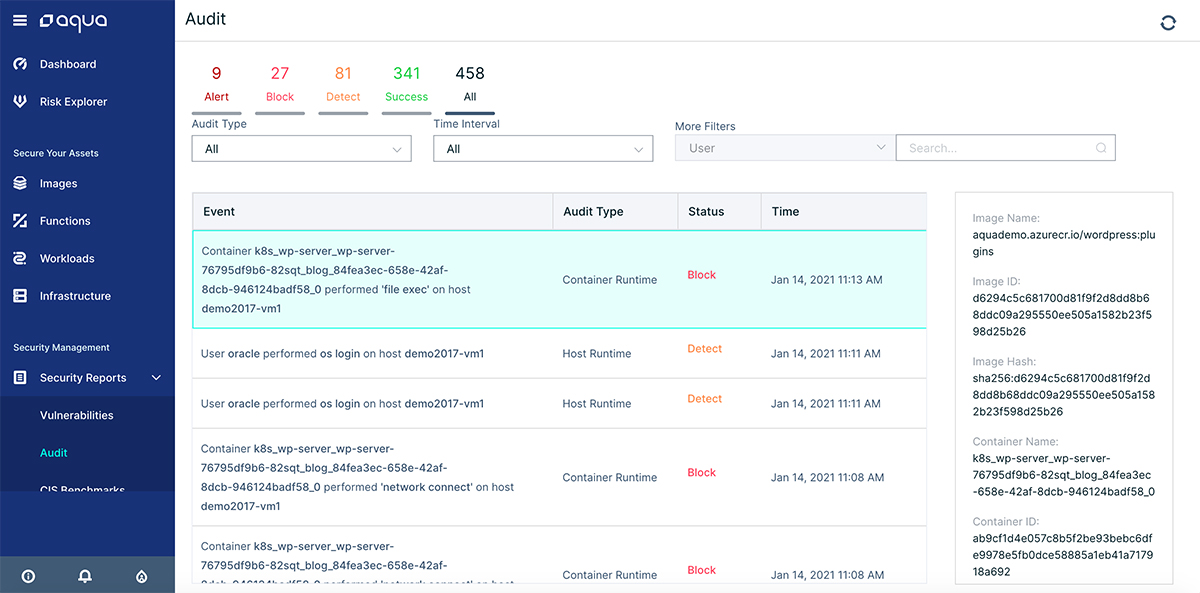
This data is displayed on the Aqua audit console or, alternatively, can be transmitted to third party SIEM or analytics tool like Splunk for further incident response. This facilitates search and analysis and helps you diagnose what was going on during an attack even when the exploited container has already gone.

The Aqua audit console view
Perform dynamic image analysis
But often it’s not enough as attackers increasingly use sophisticated evasion techniques that allow them to escape traditional defense controls and infiltrate your environment. For example, our threat research team has recently discovered four images in Docker Hub designed to execute fileless malware attacks. In this case, even if you managed to get a compromised container during the attack, it will be very hard for you to understand the kill chain of this attack and how it occurred using traditional solutions.
Such sophisticated and hidden threats are missed by static vulnerability and malware scanning and can only be detected by dynamic analysis of the container behavior as it’s running, which is what Aqua DTA (Dynamic Threat Analysis) does. It uncovers malicious elements in images by running the image in a secure sandbox to analyze its behavior. While many organizations use DTA to identify hidden and advanced threats in their images at build time before they are pushed to production, it can also be used for forensics goals after a suspected breach.
Once you know that a “rogue” image was used to perpetrate the attack, leveraging DTA can help you backtrack and discover the culprit images and analyze at the container level exactly how the attack happened and spread throughout your environments. By understanding indicators of compromise (IOCs) and indicators of interest (IOIs) identified by DTA, you can trace and visualize the entire kill chain when conducting a retrospective analysis of an attack.
Conclusion
With the ever-evolving threat landscape, forensics is becoming a key part of any enterprise security strategy. To perform post-breach analysis in a cloud native environment, it’s essential to continuously stay aware of what’s going on inside your containers and functions. On top of collecting logs at the OS, cluster, and container level, organizations can leverage dynamic analysis tools like DTA to gain insights into malicious activity in containers as well as to piece together clues about the attack kill chain.

